TL;DR
- 4-dimension quality scoring: Relevance, Groundedness, Coherence, Completeness
- Real-time hallucination detection with claim verification
- Comprehensive observability dashboard for sessions, quality trends, and agent usage
"It worked in the demo."
Those words have killed more AI projects than any technical limitation. The gap between demo and production is measured in trust—and trust requires quality guarantees.
SemanticStudio is built for production: 4-dimension quality scoring, real-time hallucination detection, and comprehensive observability.
The Quality Problem
In production AI, you need to answer:
- Is this response correct? Does it answer what was asked?
- Is this response grounded? Are claims supported by data?
- Is this response safe? Will it mislead users?
- Is the system healthy? Are quality trends stable?
Without answers, you're flying blind.
4-Dimension Quality Evaluation
Every SemanticStudio response is scored across four dimensions:
4-Dimension Quality Scoring
Every response evaluated across four dimensions
Simulate Response Quality
Score Breakdown
Does it answer the question asked?
Are claims supported by source data?
Is it logical and well-structured?
Does it cover the full scope?
Relevance
Question: Does it answer what was asked?
How it's measured:
- Query intent extracted
- Response alignment scored
- Topic drift detected
Failure mode: The response is accurate but doesn't answer the question.
Groundedness
Question: Are claims supported by source data?
How it's measured:
- Claims extracted from response
- Each claim matched to sources
- Unsupported claims flagged
Failure mode: Hallucination—confident statements with no basis.
Coherence
Question: Is it logical and well-structured?
How it's measured:
- Logical flow analysis
- Consistency checking
- Structure evaluation
Failure mode: Contradictions, jumbled reasoning.
Completeness
Question: Does it cover the full scope?
How it's measured:
- Query scope extracted
- Response coverage mapped
- Gaps identified
Failure mode: Partial answer that misses key aspects.
Hallucination Detection
The most dangerous failure in enterprise AI is confident hallucination—when the system invents plausible-sounding facts.
How Detection Works
- Claim Extraction: Parse response into individual claims
- Source Matching: For each claim, find supporting evidence
- Confidence Scoring: Rate support strength
- Flagging: Mark unsupported or contradicted claims
Example
Response: "Q4 revenue was $12.4M, representing 23% year-over-year growth."

Claim extraction:
- Claim 1: "Q4 revenue was $12.4M"
- Claim 2: "23% year-over-year growth"

Source matching:
- Claim 1: SUPPORTED (Q4 report, line 42)
- Claim 2: UNSUPPORTED (no YoY comparison in sources)

Result: Claim 2 flagged for review
User Alerts
When groundedness is low:
- Visual indicator in response
- Warning message displayed
- Sources shown for verification
Users know when to verify.
The Reasoning Pane
Transparency builds trust. The reasoning pane shows exactly what happened:
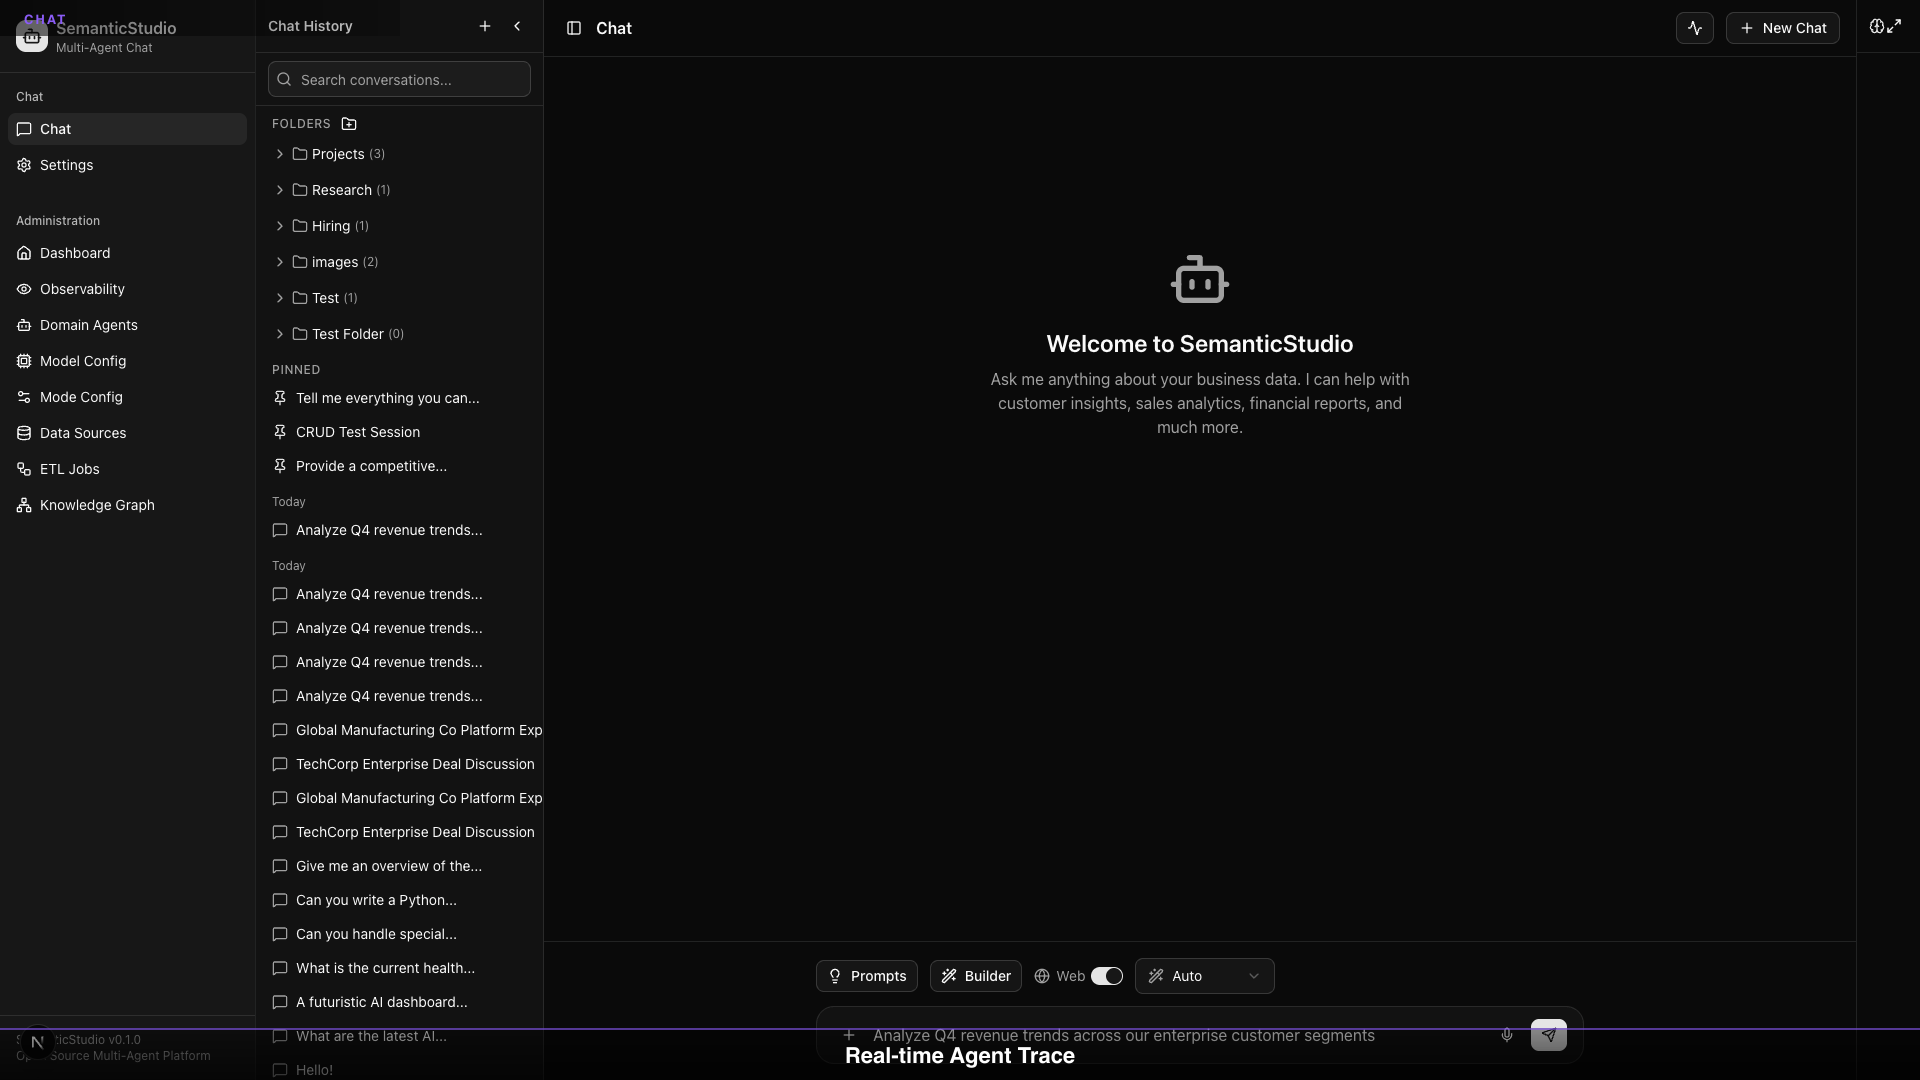
What's Visible
- Mode Classification: Why this mode was selected
- Domain Routing: Which agents were activated
- Retrieval: What was retrieved from memory and knowledge
- Quality Scores: Real-time evaluation results
- Processing Time: Latency breakdown
Why It Matters
When something goes wrong, you can:
- See exactly where it failed
- Understand why the response was shaped that way
- Identify improvement opportunities
No black boxes.
Observability Dashboard
Production systems need monitoring. SemanticStudio provides a comprehensive observability dashboard:
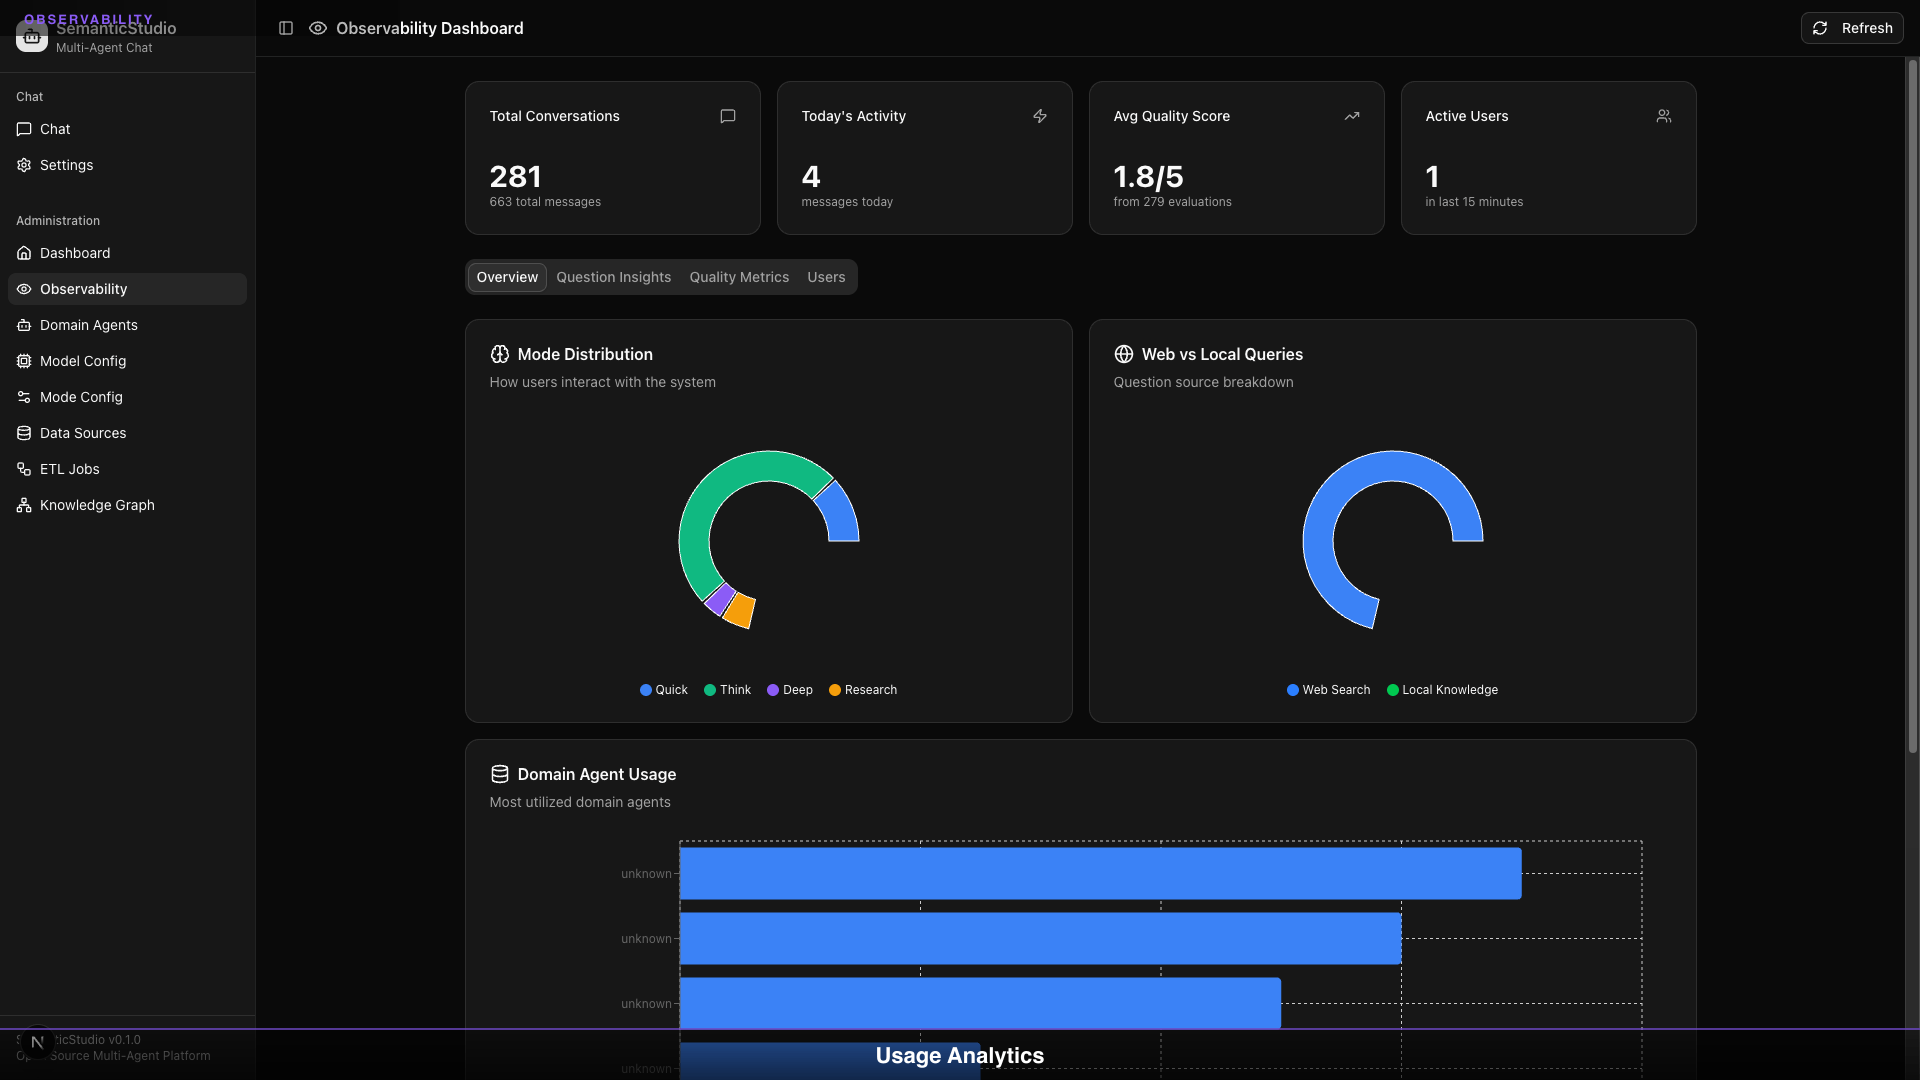
Overview Metrics
| Metric | What It Shows |
|---|---|
| Total Conversations | Session count |
| Today's Activity | Messages today |
| Avg Quality Score | Mean across all dimensions |
| Active Users | Users in last 15 minutes |
Mode Distribution
Pie chart showing query distribution:
- Quick: Fast lookups
- Think: Standard questions
- Deep: Complex analysis
- Research: Investigation
Watch for unexpected shifts—if Research mode spikes, users may be struggling to get answers.
Web vs Local Queries
Track data source usage:
- Web Search: External data
- Local Knowledge: Your data
High web search might indicate knowledge gaps.
Domain Agent Usage
Which agents get the most queries:
- High usage = valuable domain
- Low usage = review data coverage
- Zero usage = consider disabling
Quality Trends
The dashboard tracks quality over time:
What to Watch
- Quality degradation: Scores dropping?
- Hallucination spikes: Groundedness falling?
- Relevance drift: Off-topic responses increasing?
Early Warning Signs
| Signal | Possible Cause |
|---|---|
| Dropping relevance | Query patterns changed |
| Dropping groundedness | Data became stale |
| Dropping coherence | Model issues |
| Dropping completeness | Knowledge gaps |
Session Analytics
Drill into individual sessions:
Session View
- Full conversation history
- Per-turn quality scores
- Domain agents used
- Retrieval sources
Pattern Detection
- Common question types
- Failure patterns
- User feedback signals
Alerting & Monitoring
Configure alerts for:
Quality Thresholds
Alert when: Average groundedness < 0.7 over last hour
Action: Notify admin, review recent responses
Error Rates
Alert when: Error rate > 5% in last 15 minutes
Action: Page on-call, check system health
Usage Anomalies
Alert when: Query volume > 2x normal
Action: Review capacity, check for issues
Why "Works in Demo" Isn't Enough
Demos hide problems:
| Demo Condition | Production Reality |
|---|---|
| Curated questions | Messy, ambiguous queries |
| Fresh data | Stale, incomplete data |
| Single user | Concurrent load |
| Happy path | Edge cases, errors |
| Short session | Long-term usage |
Production requires:
- Quality evaluation on every response
- Continuous monitoring
- Early warning systems
- Transparency for debugging
Building Trust
Trust comes from:
1. Visibility
Users can see reasoning, sources, scores. Nothing hidden.
2. Accuracy Signals
Quality scores flag when confidence is low.
3. Consistency
Monitoring ensures stable quality over time.
4. Accountability
Traces enable debugging when things go wrong.
Lessons Learned
Building SemanticStudio taught me:
1. Quality Evaluation Is the Product
Users don't care about your architecture. They care if answers are right.
2. Observability First
You can't improve what you can't measure. Build monitoring before features.
3. Hallucination Is the Enemy
Confident wrong answers are worse than "I don't know."
4. Transparency Beats Polish
Users trust systems they can understand, even if imperfect.
5. Production Is Earned
Every demo feature needs a production counterpart.
What's Next for SemanticStudio
This is Part 8—the end of the series, but not the end of the project.
Roadmap
- Multi-modal understanding: Handle images, audio, video in data sources
- Cross-domain collaboration: Agents that work together on complex queries
- Reinforcement learning: Learn from user feedback to improve over time
- Voice interface: Natural speech interaction
Contributing
SemanticStudio is open source. Contributions welcome:
- Bug reports: What doesn't work?
- Feature requests: What's missing?
- Pull requests: Help build it!
GitHub: https://github.com/Brianletort/SemanticStudio
Wrapping Up the Series
Over 8 posts, we've covered:
- Introduction: Why I built SemanticStudio and the enterprise AI checklist
- Chat Experience: Sessions, folders, files, preferences
- Multi-Agent: 28 domain agents and orchestration
- RAG Configuration: Models, modes, and fine-tuning
- Memory System: 4-tier architecture for context
- GraphRAG: Knowledge graphs and relationship discovery
- ETL: Self-learning pipelines and agent creation
- Production Quality: Evaluation, observability, and trust
This isn't the AI future I read about.
It's the AI future I built.
Now it's open source. Go build something.
Building SemanticStudio
Part 8 of 8